

Ed Marsh
Ed was going to be an architect, before he was going to be an engineer, before he graduated from Johns Hopkins, before he was an Army Infantry Officer (Airborne Ranger), before he set B2B industrial sales records, before he was partners with a German capital equipment manufacturer, before he founded a distribution company for industrial products in India, until he concluded that managing operational details wasn't what he enjoyed and started helping others.
Today, Ed works exclusively with lower-middle and middle-market industrial manufacturers and their private equity sponsors to build predictable, scalable organic revenue growth.
Where Does Your Revenue Engine Sit on the Curve?
Most industrial companies don't know what 'good' looks like. The maturity model gives you a benchmark, and a roadmap to the next level.
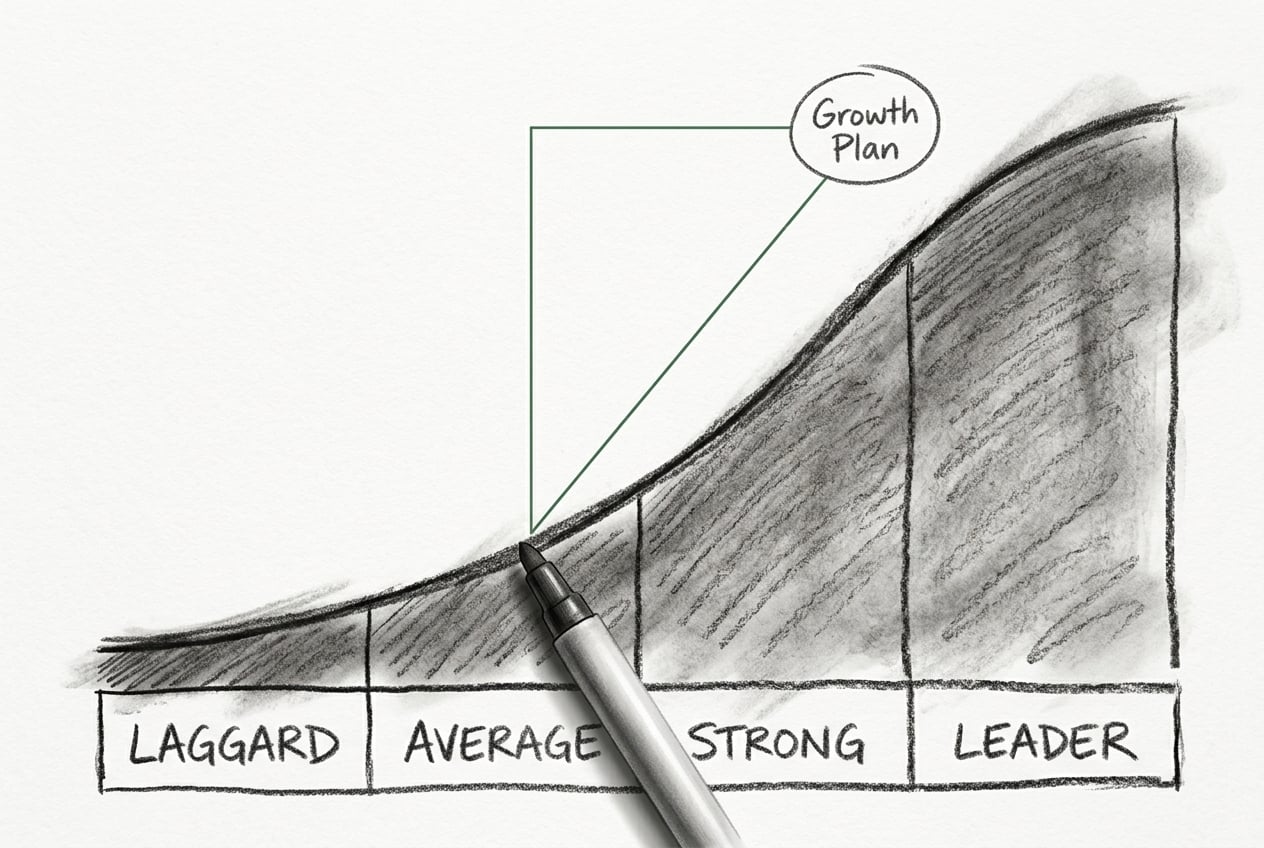
There are four levels of sales and marketing maturity in industrial companies: laggard, average, strong, and leader. Most companies sit at average and don't know it, because they're benchmarking against their direct competitors instead of against what's actually possible. The maturity model assesses 17 dimensions of revenue function, from ICP definition through forecasting through hiring through sales technology, and tells you exactly which dimensions are dragging the others down.
What separates a 'strong' organization from an 'average' one usually isn't budget or headcount. It's whether the basics (defined ICP, real sales process, accountable CRM use, predictive hiring) are actually in place and being used. Most aren't.
Most Industrial Sales Teams Don't Have a Playbook
Methodology, process, playbooks, battle cards, qualification scorecards. The artifacts that drive predictable revenue are missing, and most leaders don't know how to build them.
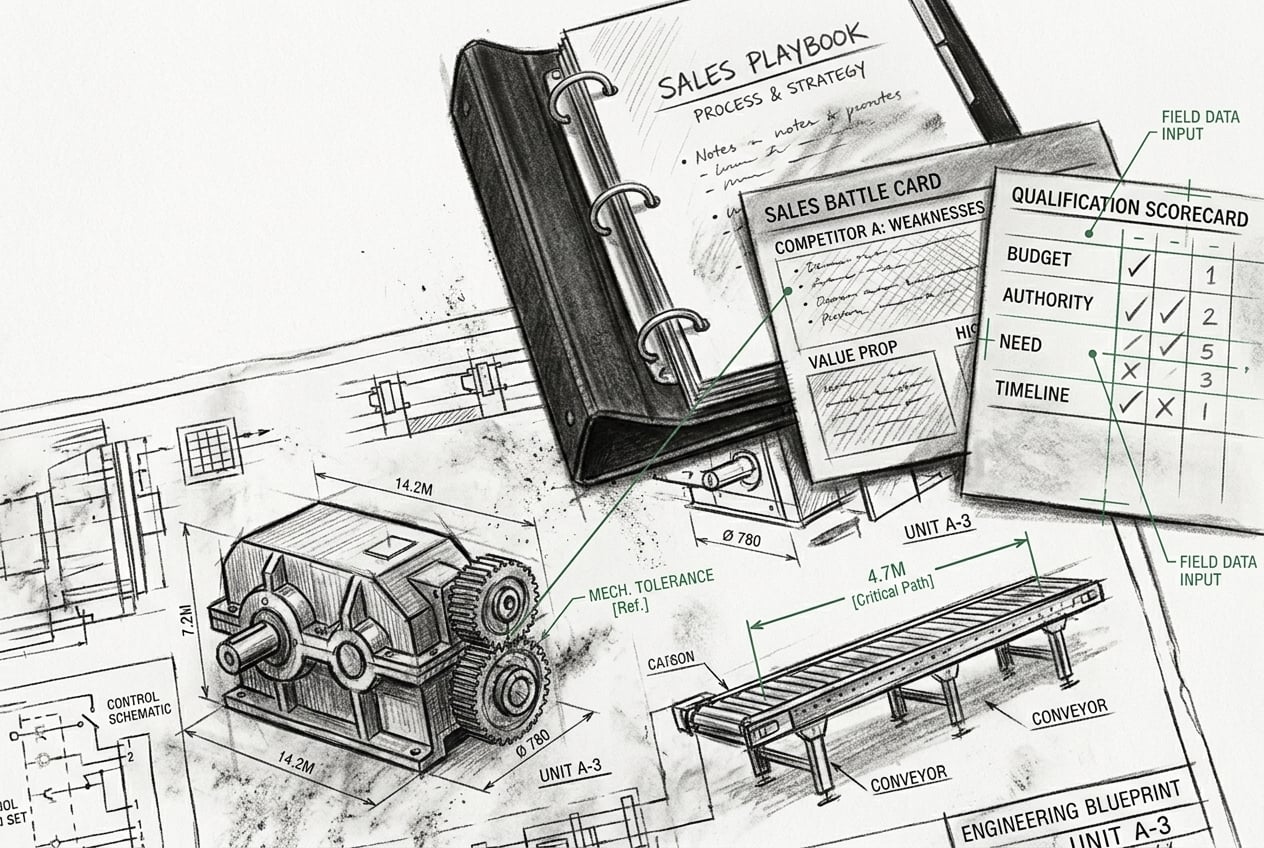
There's a difference between methodology and process. Methodology is the philosophy: Sandler, Challenger, MEDDIC, Solution Selling. Process is the operational sequence your reps follow inside that methodology: what they do at each stage, what they need to advance, what tools they use, what data they capture. Most industrial sales orgs have neither. They have a CRM with stage names that mean nothing, reps who run discovery the way they always have, and a manager who runs forecast calls by asking 'how confident are you in this deal?'
The artifacts (battle cards, qualification scorecards, discovery question libraries, pre-call plans, objection handling guides) are what turn methodology into daily practice. Without them, you're hoping every rep figured it out on their own. Most haven't.
67% of Industrial Sales Hires Fail Within 18 Months
Predictive assessment identifies who will succeed before you extend the offer. Most industrial companies still hire on resume and gut feel, and get exactly the average results that approach delivers.
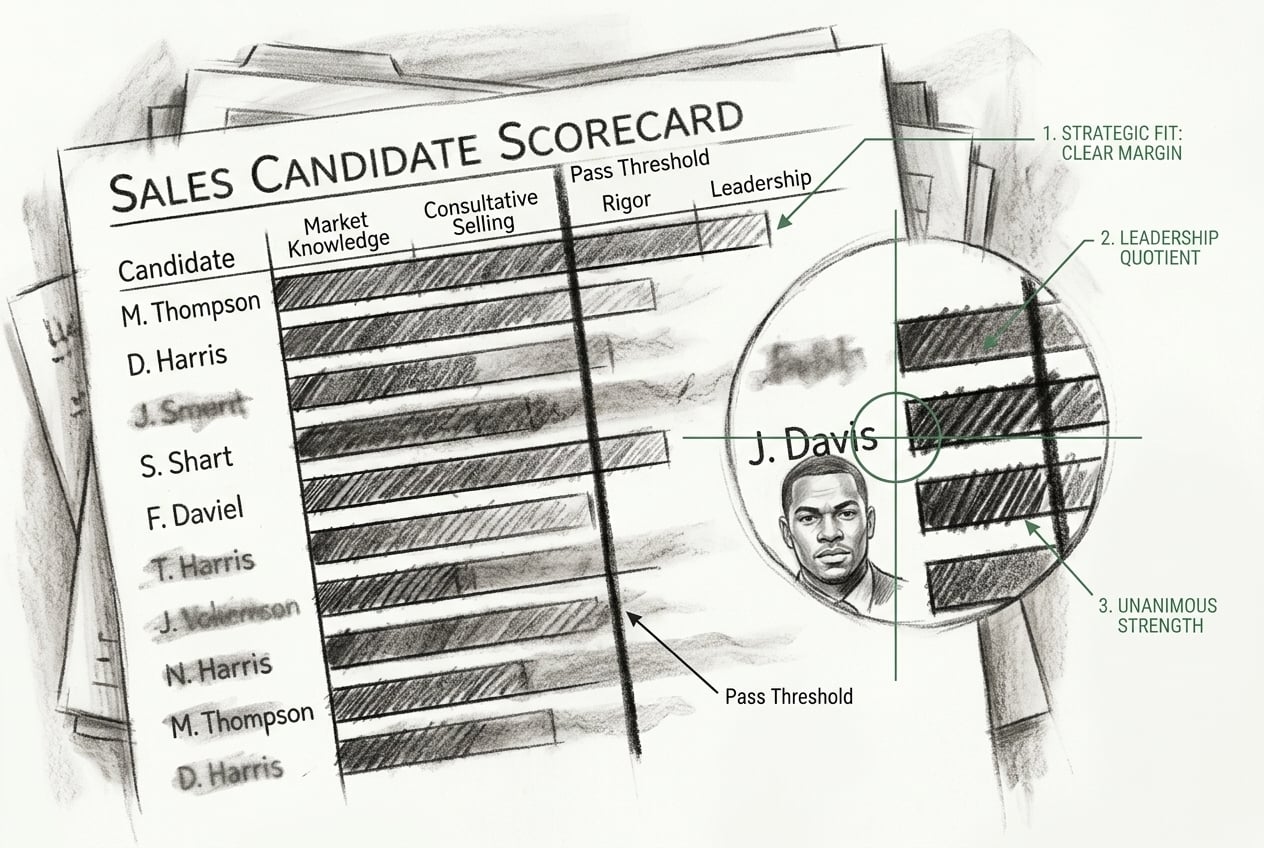
Resumes have 18% predictive validity for sales success. Personality tests, 20%. Reference checks, 23%. Even IQ tests only get to 51%. The only assessment with documented predictive validity above 80% is sales-specific assessment, built on years of data correlating individual rep traits and behaviors with actual field sales outcomes. Most industrial companies don't use it. They keep hiring the candidate who interviewed well, then act surprised when 67% wash out within 18 months.
The fix isn't a better recruiter or a better interview process. It's an engineered hiring system: predictive assessment first, structured interview second, scorecard-based decision third. Same rigor your engineering team applies to component sourcing, applied to the most expensive component in your revenue function.
The Most Misunderstood Role in Industrial Sales
First-line sales managers are usually promoted top reps, and almost always lack the skills the role actually requires. Coaching, accountability, pipeline management, talent development.
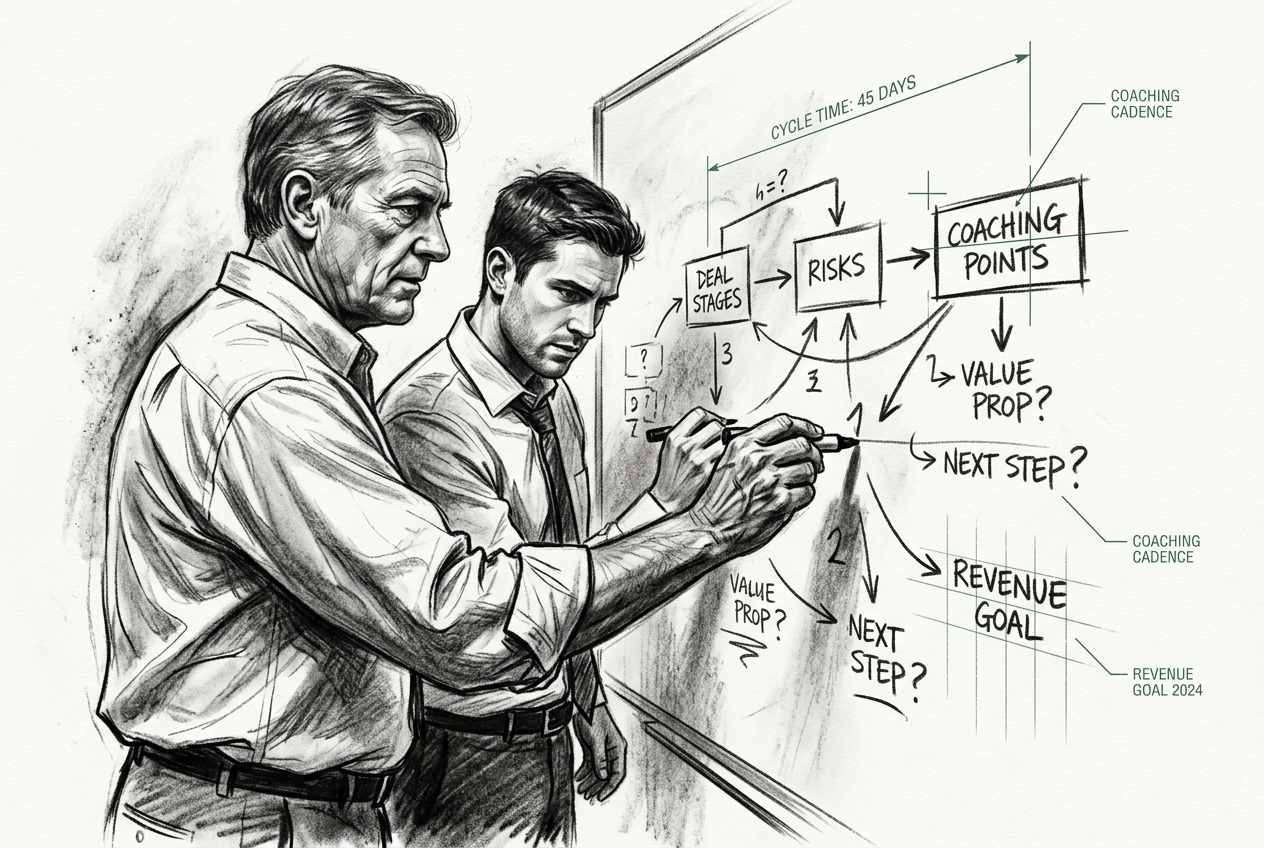
The skills that make someone a great rep have almost nothing to do with the skills that make someone a great sales manager. Great reps are individual contributors who close deals. Great managers coach other people to close deals, which means they spend their day asking diagnostic questions, holding people accountable to process, and developing talent that will eventually outgrow them. Most newly promoted managers do none of these things, because nobody ever taught them how. They run forecast calls, send pipeline reports, and try to close their team's deals for them.
The fix is structured sales management training and a defined operating cadence: weekly 1:1s with a coaching agenda, pipeline reviews with inspection, deal reviews that build skills rather than rescue deals, and accountability for the leading indicators that actually move the lagging ones.
Comp Plans Drive Behavior. Most Drive the Wrong Behavior.
Salespeople do exactly what you pay them to do. If your comp plan rewards activity over outcomes, units over margin, or new logos over expansion, you're getting exactly what you designed.
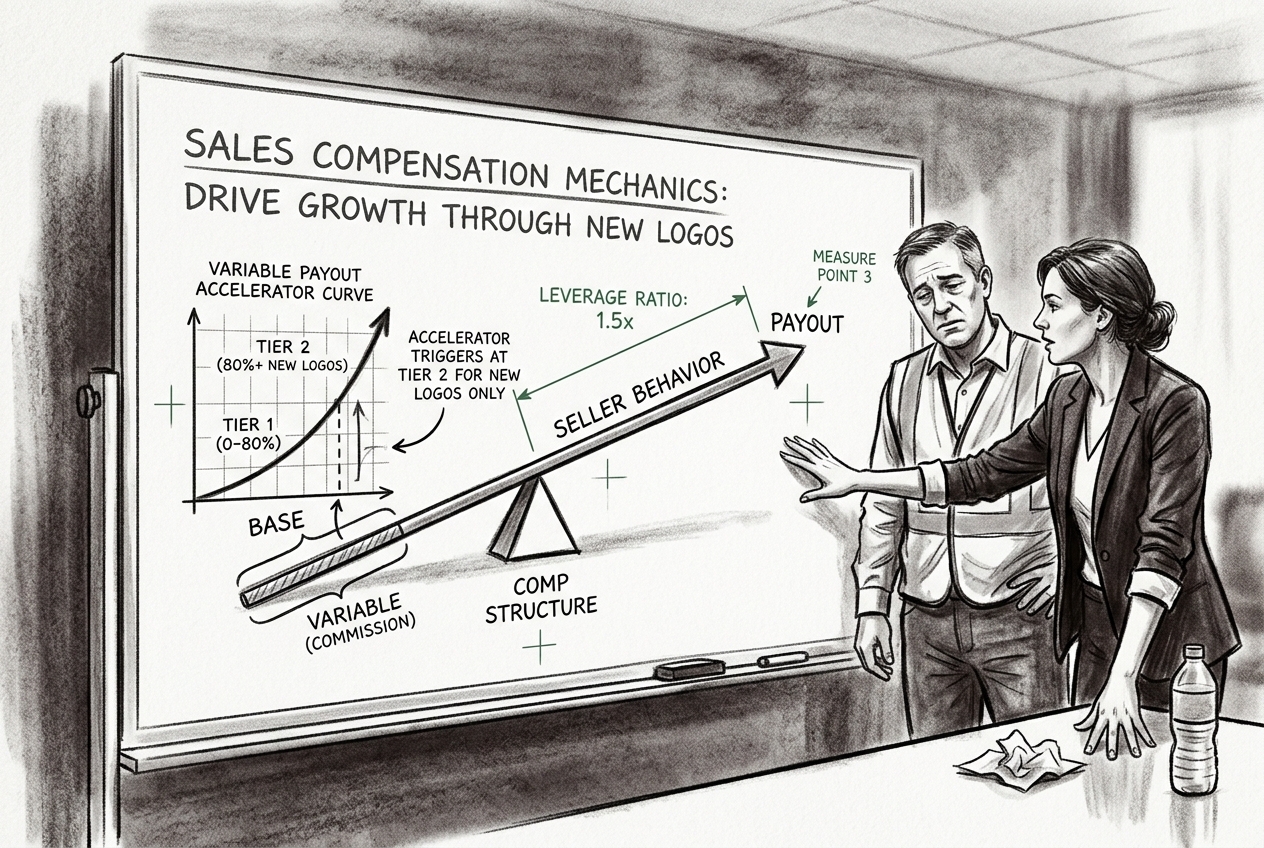
Compensation design is one of the highest-leverage and least-understood levers in industrial sales. Most plans are built by HR using a template, signed off by finance, and never revisited until the year they're catastrophically misaligned with strategy. The result: reps who hit quota but don't move the metric the business actually cares about. Reps who chase volume and crush margin. Reps who farm existing accounts because that's where the path of least resistance lies.
Good comp design starts from strategy (what is the business trying to do this year?) and works backward to the behavior that produces it. Then it picks measurable proxies for that behavior, sets achievable-but-stretching targets, and builds in accelerators that reward overperformance without bankrupting the business.
Buyers Don't Buy Machines. They Buy Outcomes.
Reduced downtime. Faster throughput. Lower TCO. Engineered reliability. Reshape your sales conversation from 'what we make' to 'what you get.'
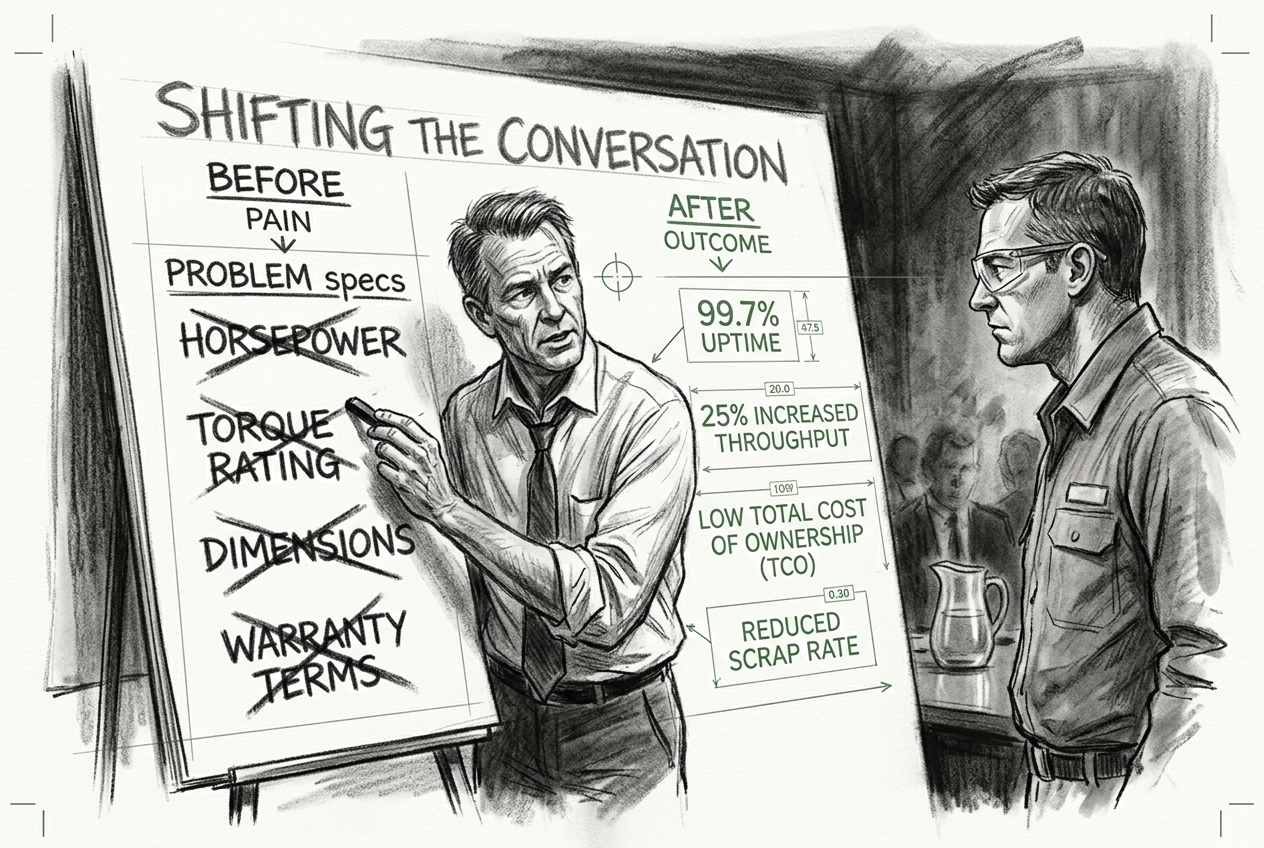
Industrial sales teams love their products. They know the specs, the engineering, the manufacturing process. Then they get in front of a buyer and recite all of it, and wonder why the buyer's eyes glaze over. The buyer doesn't care about your specs. The buyer cares about throughput, downtime, total cost of ownership, regulatory compliance, and how this affects the metric their boss measures them on. Outcome-based selling is the discipline of starting every conversation on the buyer's side of the table: what are you trying to achieve, what's getting in your way, and how do we get from here to there.
The reframe is mechanical: every spec on your product sheet maps to an outcome. 'Stainless steel construction' becomes 'eliminates corrosion-related downtime.' 'PLC integration' becomes 'plugs into your existing line without retooling.' 'Modular design' becomes 'expandable as your throughput grows.' Same product. Buyer-side language.
Buyers Make Five Decisions. Most Reps Only Address One.
Industrial sales teams focus on vendor selection. They miss the earlier decisions where deals actually get approved, or where they die in 'no decision.'
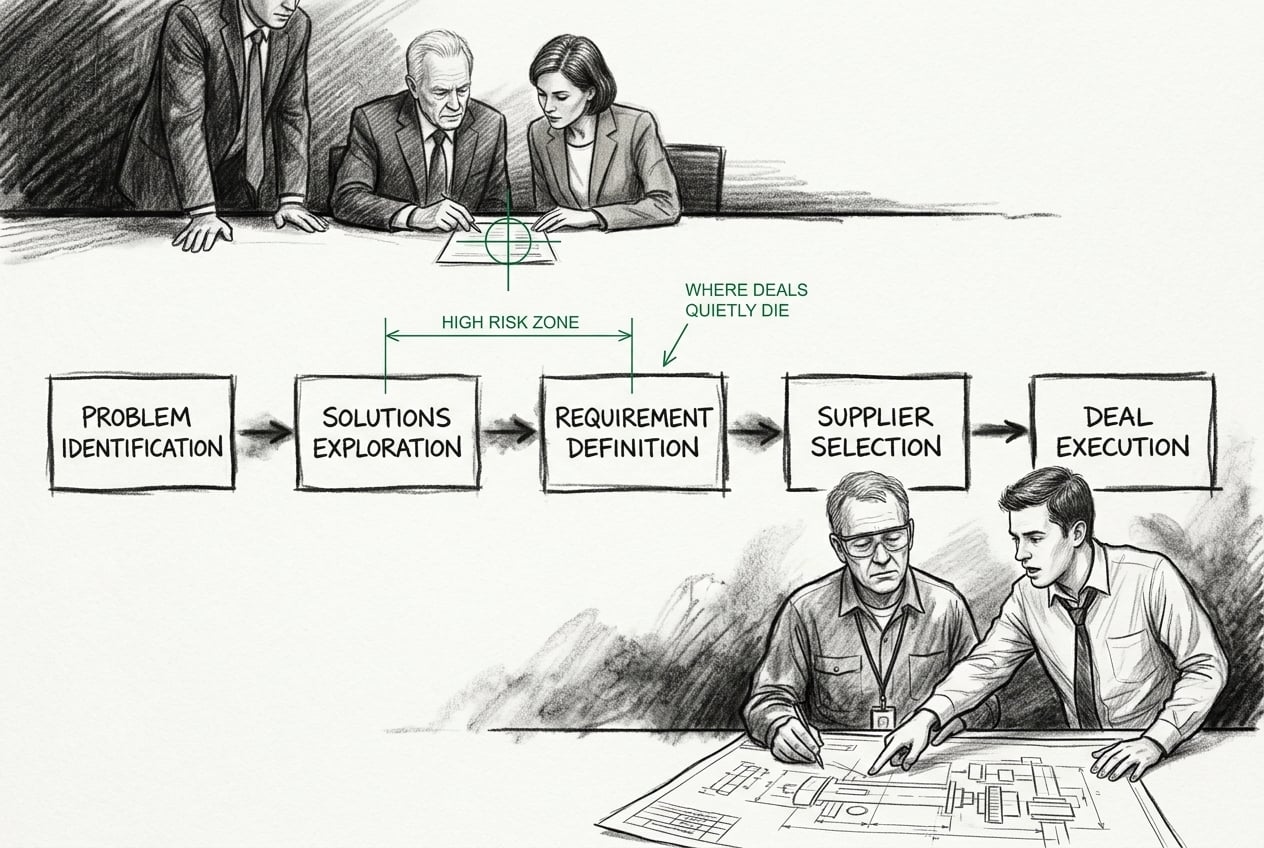
There are five decisions a buying committee makes during a complex industrial purchase. Decision 1: should we even commit internal resources to evaluate this? Decision 2: should we request capital from finance? Decision 3: should the board or committee approve the capital? Decision 4: how will we choose a vendor? Decision 5: which vendor do we pick? Most sales teams pour 100% of their effort into Decision 5. They miss Decisions 2 and 3 entirely, and those are the decisions where most deals quietly die.
When a deal ends in 'no decision,' it's almost never a vendor selection problem. It's a Decision 2 or 3 problem: the buyer's internal capital request never got made, or got made and got rejected. Your champion needed ammunition you didn't give them. Your rep didn't know the request was happening. The deal you thought was 50/50 was actually decided weeks ago without you in the room.
If You Can't Model the Funnel, You Can't Forecast the Year
Pipeline coverage. Conversion rates. Sales velocity. Deal size. Most industrial sales orgs run on instinct. Funnel math turns instinct into engineering.
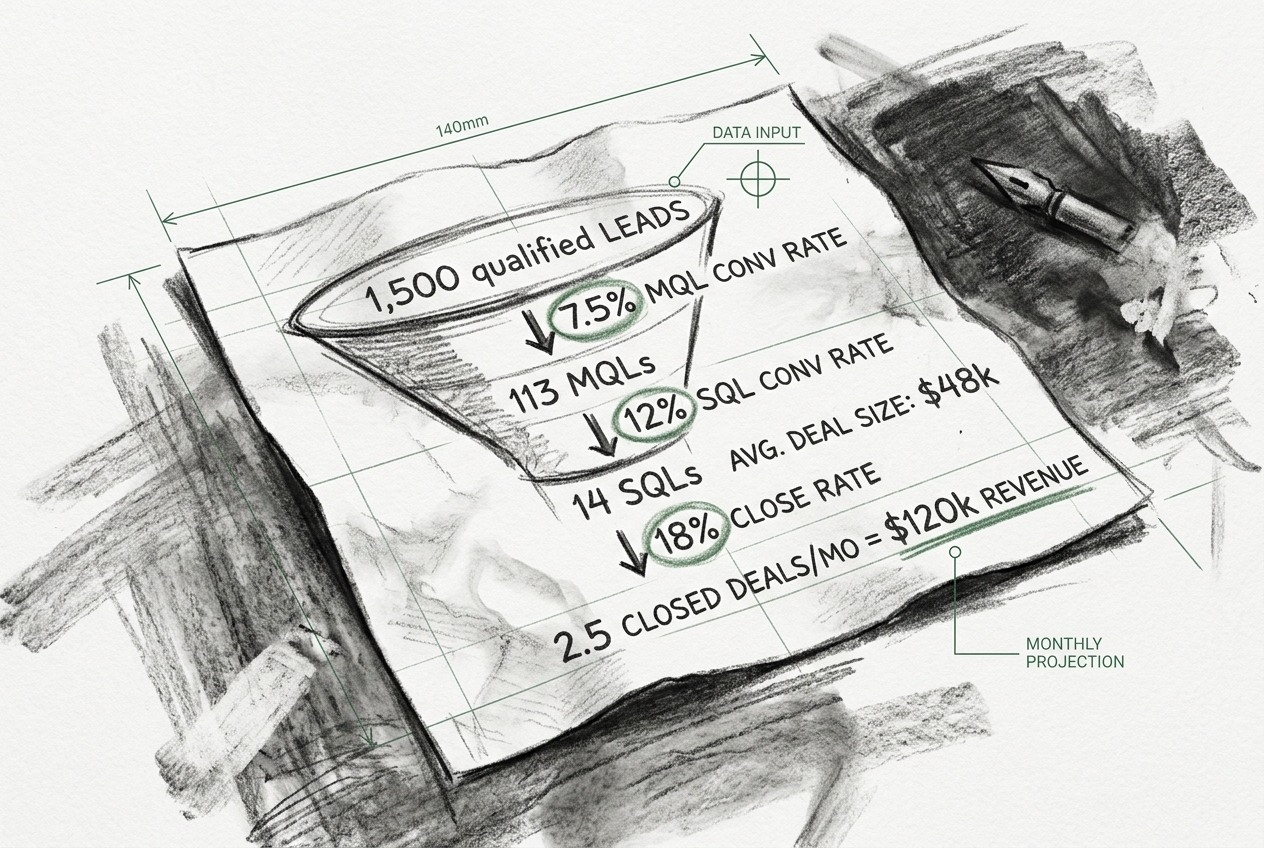
Funnel math is the engineering discipline applied to revenue. It's the calculation that says: given my historical conversion rates between stages, given my average deal size, given my average sales cycle, and given the pipeline I have today, what's the probability I hit my number? Most industrial companies don't have these inputs. They have a CRM with stages but no measured conversion rates. They have closed deals but no average cycle time. They have a quota but no pipeline coverage ratio. So they forecast by feeling.
The fix is mechanical: clean stage definitions, disciplined CRM hygiene, measured conversion rates, calculated coverage ratios, and a model that connects pipeline today to closed revenue six to twelve months out. Once it exists, forecasting becomes a math problem instead of a vibes problem.
Your Forecast Is Wrong. Here's Why.
Industrial sales forecasts are usually fiction: built on rep optimism, manager wishful thinking, or sandbagged numbers. Real accuracy comes from process, not from asking reps how confident they feel.
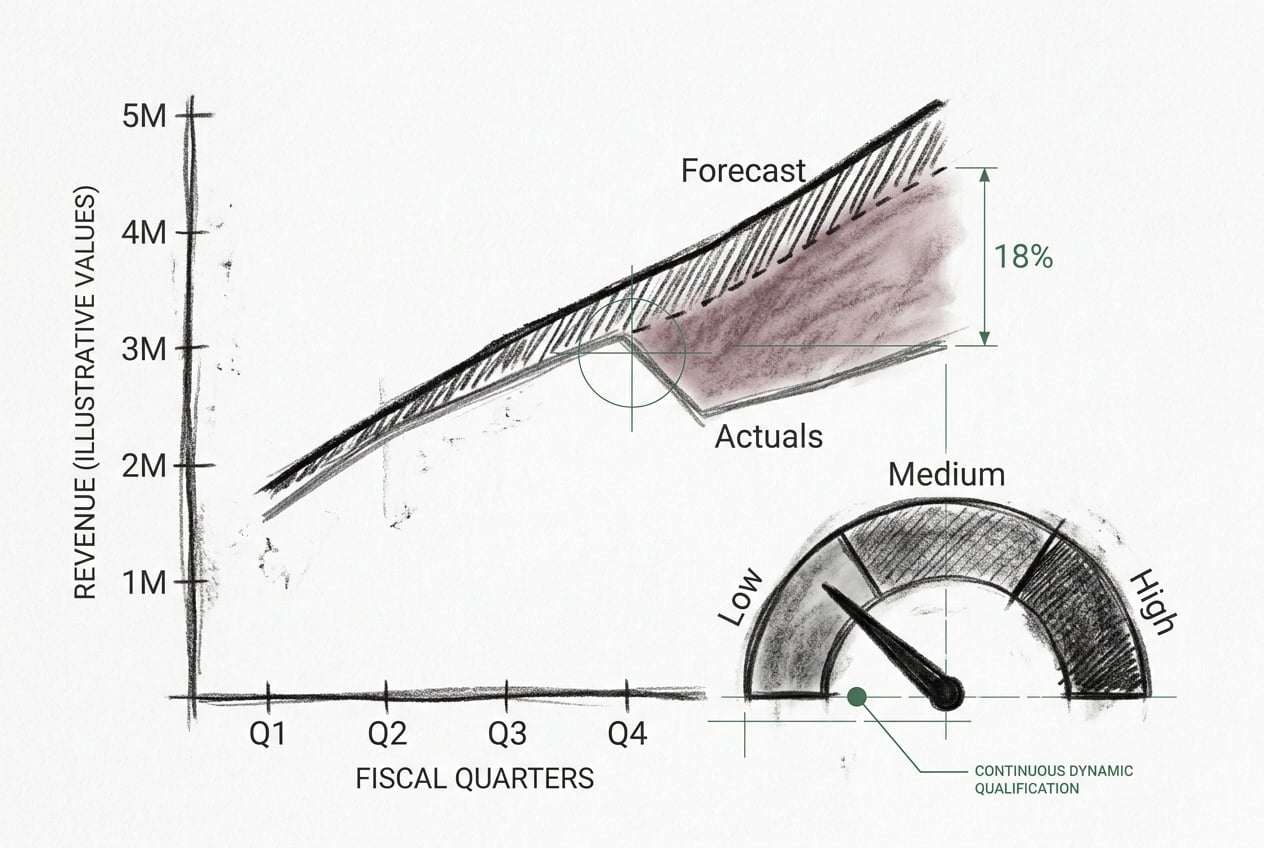
Most sales forecasts miss by 20–40%. They miss because they're built on the wrong inputs: rep feelings about their deals, manager guesses based on history, finance pressure to hit a number that was set six months ago and has nothing to do with current reality. Real forecast accuracy comes from a forecast process: defined deal stages with objective entry criteria, regular pipeline inspection, deal-level qualification scorecards, and a forecasting cadence that catches problems early enough to do something about them.
The hard part isn't the math. The hard part is the discipline: getting reps to update CRM weekly, getting managers to inspect deals instead of rescue them, getting finance to trust the data, and getting leadership to treat the forecast as a decision-making tool instead of a stick to beat the team with.
CRM, Marketing Automation, AI, and the Mess in Between
Most industrial companies have technology that doesn't talk to itself. The right stack is invisible. The wrong stack creates work that nobody does.
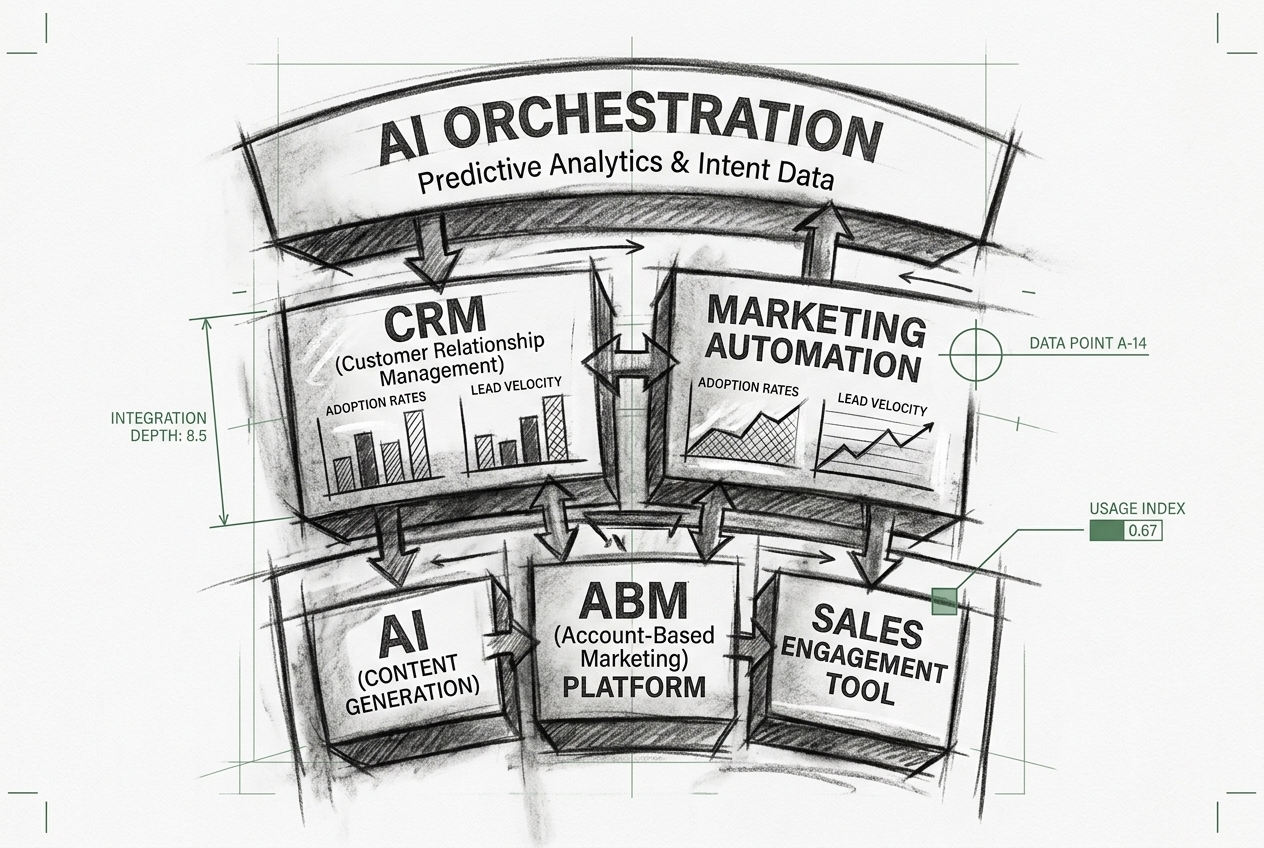
The industrial revenue tech stack has four layers: CRM (the source of truth for accounts and deals), marketing automation (the engine for nurture and lead routing), sales acceleration (the tools reps actually use day-to-day), and an analytics/AI layer that turns the data from the other three into insight. Most industrial companies have pieces of all four layers but they don't integrate, the data is dirty, and reps work around the system rather than through it. The wrong stack actively destroys revenue by creating work that nobody does and reports that nobody believes.
The right stack is invisible to the rep: they open one tool, see what they need, take action, and the rest of the system updates in the background. Getting there isn't a tooling decision. It's a process decision first, an integration decision second, and a tooling decision third. Most companies try to do it in the reverse order and end up with a $200K/year stack that nobody uses.
Most Industrial Revenue Flows Through Partners
Reps, distributors, integrators, OEMs, channel resellers. Most industrial companies treat partners like an afterthought, and leave half their organic growth on the table.
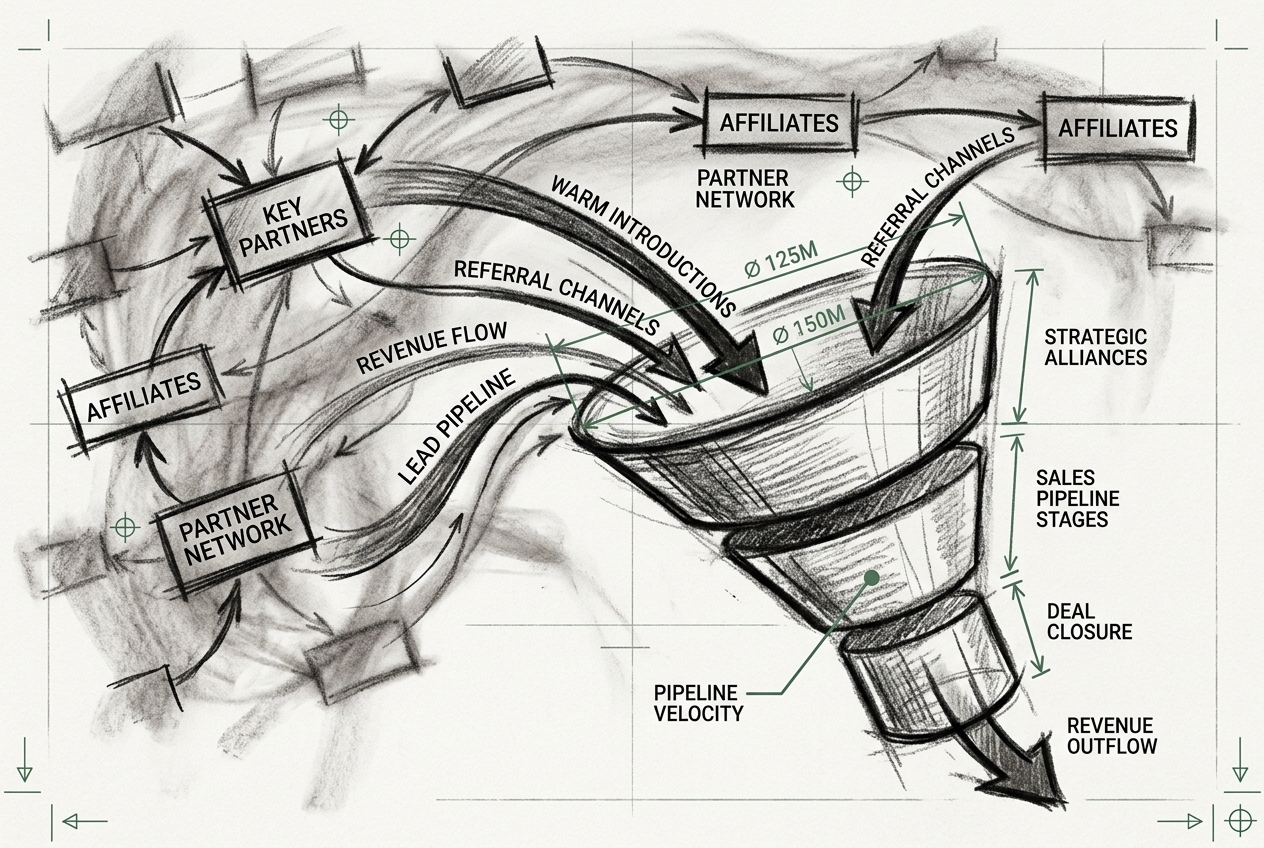
Industrial revenue is rarely direct. It flows through manufacturers' reps, distributors, system integrators, OEM partners, and channel resellers. The companies that grow fastest treat their partner ecosystem with the same rigor they apply to their direct sales team: defined ICPs for partners, structured onboarding, co-selling motions, joint marketing programs, and accountability for partner-attributed revenue. Most industrial companies do the opposite: they sign anyone who shows up with a business card, send them a price list, and hope.
Partner marketing is the discipline of building demand jointly with partners: co-branded content, co-hosted events, joint case studies, MDF programs that actually generate measurable activity instead of subsidizing partner overhead. It's a force multiplier when done well. It's a money pit when done badly. The difference is whether there's a strategy.
Talk to Ed About Your Sales Team
Sharp diagnostic questions. An honest read on whether Ed can help, and if he can't, who can.
An honest read on your sales team.
No pitch deck. No proposal cycle. No follow-up automation. Ed asks sharp diagnostic questions about your organic growth challenge and gives you an honest read on what's actually happening.
- A clear next step, a better referral, or a few things you can do this week
- Ed's read on whether your sales problem is people, process, or strategy
- If Ed isn't the right fit, he'll tell you who is

Prefer to leave Ed a message instead?
No calendar, no obligation. Ed reads every message personally.
▼
Ed reads every message personally and usually responds within 24 hours.